Pentaho Dashboard Designer
Creating a dashboard in Dashboard Designer is as simple as choosing a layout template, theme, and the content you want to display. In addition to displaying content generated from Interactive Reports and Analyzer, Dashboard Designer can also include these content types:
Charts
Simple bar, line, area, pie, and dial charts created with Chart Designer.
Data Tables
Tabular data.
URLs
Web sites that you want to display in a dashboard panel.
Dashboard Designer has dynamic filter controls, which enable dashboard viewers to change a dashboard's details by choosing different values from a drop-down list, and to control the content in one dashboard panel by changing the options in another. This is known as content linking.
Get started with the Dashboard Designer
Procedure
In the Folders pane, click to expand the Public folder, then click to highlight the Steel Wheels folder.
In the center pane, double-click on Sales Performance (dashboard).
After the dashboard opens, click Edit in File Actions.
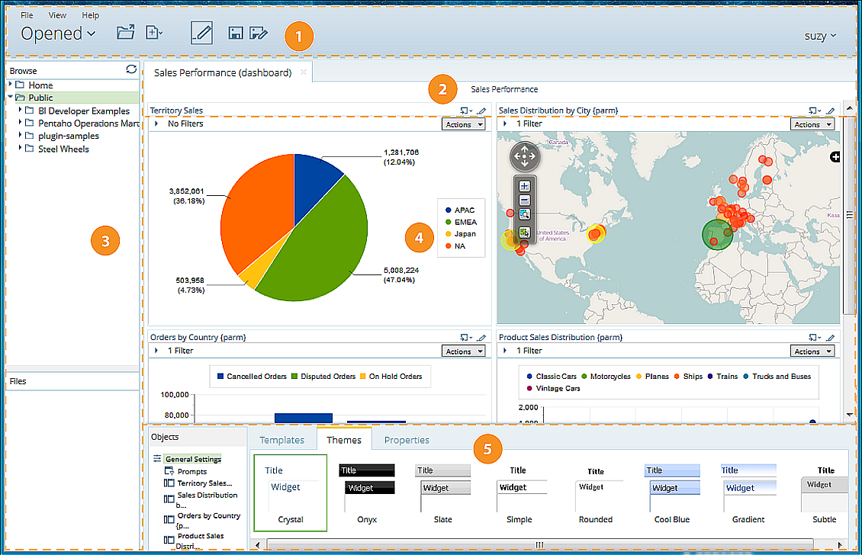
Item Name Function 1 Opened view Displays quick access buttons across the top to create and save new Analyzer Reports, Interactive Reports, and dashboards. Opened reports and files show as a series of tabs across the page. 2 Prompts panel The Prompts panel gives you a way to add filters to the individual parts of your dashboard. 3 Browse folders and Files panels Locate your files using the Browse and Files panels, and add them to dashboards. 4 Dashboard canvas Shows a dynamic view of your dashboard as you work to build it. The look of your dashboard refreshes as you add content from the Browse folders and Files panels, and work with the Prompts or Objects panels. 5 Objects panel Refine the look of your dashboard with the Objects panel by choosing a dashboard template or changing the titles for each object in the dashboard.
Creating dashboards
When you create new dashboards, you have options to add Analyzer and Report Designer reports and even websites to your dashboard. You can also customize your dashboard with previously created charts, tables and files.
Create a dashboard
Procedure
From the User Console Home page, click Create New, then select Dashboard.
The name you entered appears on the top left corner of the dashboard. This name helps you identify the page if you want to edit, copy, or delete it later.On the bottom of the page, click the Properties tab, and enter a title for your dashboard page in the Page Title text box.
Click Templates to choose a dashboard layout.
A blank dashboard with the layout you selected appears.Click Theme to choose a theme for your dashboard.
The theme you selected is applied to your dashboard.
Results
Add a report from Analyzer
Procedure
Select a panel in the Dashboard Designer.
Click Insert and choose File.
Locate the appropriate analysis report and click Select.
The report appears inside the dashboard panel.
Add a report from Report Designer
Procedure
Select a panel in the Dashboard Designer.
Click the Insert icon and choose File.
A browser window opens.Locate the appropriate report file.
Click Select to place the report inside the dashboard panel.
Pagination control arrows at the top of a report allows you to scroll through long reports. Notice that the report file name, Inventory.prpt, appears under Content in the dashboard edit pane in the sample below. This sample report contains parameters. You can enter values manually and link them to a dashboard filter in the text boxes under Source. When the report renders again, the parameter value(s) you entered are included in the report.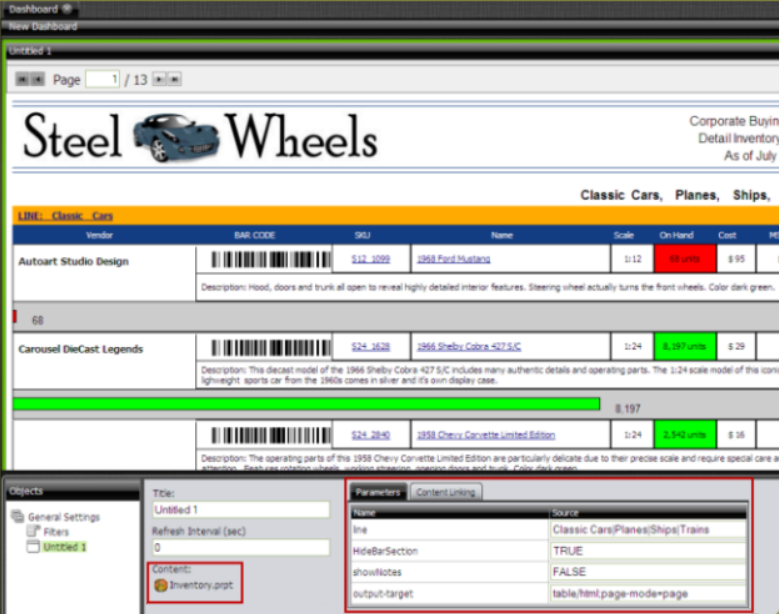 ImportantIf you choose a Report Designer file to place in a dashboard, but do not supply values for required parameters, the report will show up blank.
Add a website
Procedure
Select a panel in the Dashboard Designer.
Click the Insert icon and select URL.
The Enter Web site dialog box appears.Enter the website URL in the text box and click OK.
If applicable, click the Edit icon to make changes.
Drag-and-drop content
Procedure
In the left pane of the Pentaho User Console, under Files, locate to the content (chart, table, or file) you want added to your dashboard.
Click and drag the content into a blank panel on your dashboard.
You will see the "title" of the content as you move it around the dashboard. Notice that the title background is red; it turns green when you find a panel where the content can be dropped.Repeat steps 2 and 3 until your dashboard contains all the content you want to display.
To swap content from one panel to another, click the title bar of the panel that contains the content you want moved and drag it over the panel you want swapped. You will see the swap icon as you are moving the content.NoteIf you are working with an existing dashboard, you can perform steps 2 and 3 steps; however, a warning message appears when you try to place content in a panel that already contains content. The new content will override the existing content.
Create a chart
Adjust white space in dashboard panels
Procedure
In the lower pane, click General Settings and then click the Properties tab.
Click Resize Panels.
The white space between the dashboard panels turns blue.Adjust the panel size by clicking and holding the left mouse button down as you move the blue lines (white space) around. Release the mouse button when you are satisfied with the positioning of the panel.
Click Close in the lower-right corner of the dashboard to exit resize layout mode.
Examine the dashboard contents to make sure they are placed correctly.
You can return to the resize layout mode if you need to make additional changes.
Set the refresh interval
Procedure
To set the refresh interval for individual panels in the dashboard, click the Edit button and the choose the panel that contains the content you want refreshed in the Objects panel.
Under Refresh Interval (sec) enter the interval time in seconds and click Apply.
(Optional) If you want the entire dashboard to refresh, click the Prompts tab in the dashboard and set your refresh interval.
Save a dashboard
Procedure
Click the Save As button (floppy disk and pencil icon) to open the Save As dialog box.
In the File Name text box, type a file name for your dashboard.
Enter the path to the location where you want to save the dashboard.
Alternatively, use the Up and Down arrows or click Browse to locate the solution (content files) directory in which you will save your dashboard.Click Save.
The report saves with the name specified.
Advanced topics
The following topics help to extend your knowledge of Dashboard Designer beyond basic setup and use:
- Set dashboard parameters. If you are placing a file inside a dashboard panel, the file may include parameters defined for its content.
- Use prompts on dashboards. You can use prompts to display a user-selected subset of data.
- Use data tables in a dashboard. You can display a tabular representation of a database query in a dashboard.
- Use content linking to create interactive dashboards. Content linking allows you to associate (link) content in one dashboard panel to content on another dashboard panel.
- Create Pentaho Dashboard Designer templates. Templates allow you to standardize how you reports are presented.
- Secure SQL filter function access. You can set up restricted access to a SQL filter for greater control over a database query.