Get started with Dashboard Designer

Dashboard Designer allows you to create dashboards with little or no training. The dashboard is several different reports brought together inside one screen. Use Dashboard Designer if you want to create an interface to view many different reports at once, have quick access to web pages that you visit often, or view dynamic charts and graphs within a space while you create reports in another.
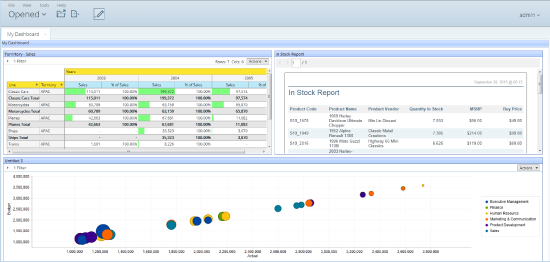
View a Dashboard sample
Procedure
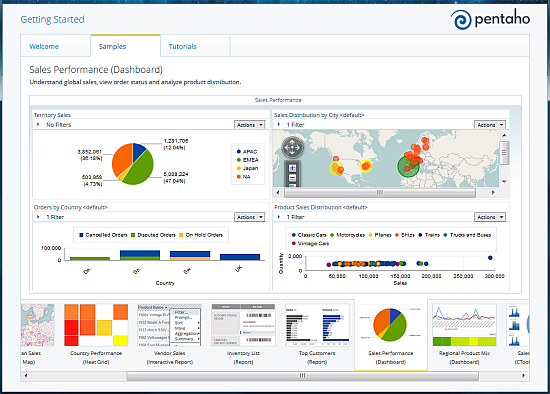
In the Getting Started widget on the Home page, click the Samples tab.
Scroll down to find the Sales Performance (Dashboard) sample. Click Explore to open a new browser screen, then click the Samples tab.
Scroll right in the horizontal list of items (at the bottom of the screen). Find Sales Performance (Dashboard) and click it to view the sample.
Tour the Dashboard panels
Follow these steps:
Procedure
In the Folders pane, click to expand the Public folder, then click to highlight the Steel Wheels folder.
In the center pane, double-click Sales Performance (Dashboard).
After the dashboard opens, click Edit in File Actions.
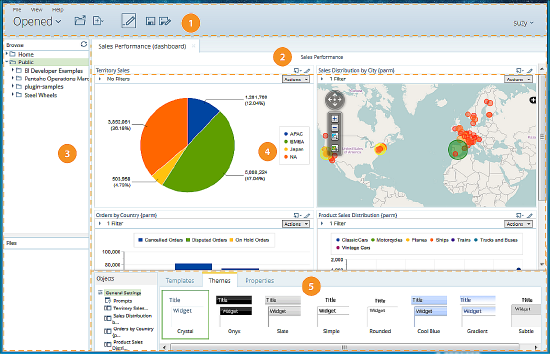
Item Name Function 1 Opened page Displays quick access buttons across the top to create and save a new Analysis Report, Interactive Report, and Dashboard. Opened reports and files show as a series of tabs across the page. 2 Prompts panel The prompts panel gives you a way to add filters to the individual parts of your dashboard. 3 Browse and Files panel Locate your files using the Browse and Files panels, and add them to dashboards. 4 Dashboard canvas Shows a dynamic view of your dashboard as you work to build it. The look of your dashboard refreshes as you add content from the Browse and Files panels, and work with the prompts or Objects panels. 5 Objects panel Refine the look of your dashboard with the Objects panel by choosing a dashboard template or changing the titles for each object in the dashboard.
Create your first dashboard
Procedure
From the User Console Home page, click Create New, then choose Dashboard.
In the Edit pane, click the Templates tab and select the 2 over 1 layout to use for this exercise.
Click the Properties tab, and type My Dashboard in the Page Title text box.
This is the title for your dashboard page.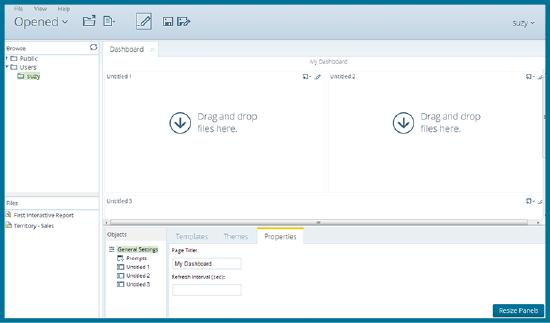
Click the Themes tab and select the theme of your choice.
The new theme will be applied to your dashboard immediately.Locate the Analyzer report you created earlier by going to the Browse pane to the left of the dashboard canvas and clicking on the folder you used before. Click-and-drag the Territory - Sales file from the Files pane and onto the top-left dashboard panel.
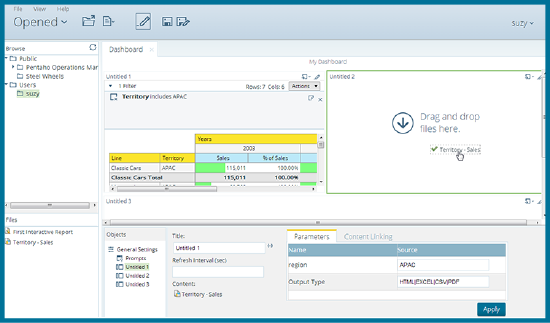
Within the Edit pane, type Territory - Sales in the Title text box and click Apply.
The dashboard panel is populated with the Territory - Sales report.Locate your Interactive report through the Browse pane. Click-and-drag the In Stock Report file from the Files pane and onto the top-right dashboard panel.
Within the Edit pane, type In Stock Report in the Title text box and click Apply. Enter a title for this dashboard panel and click Apply.
The right dashboard panel is populated by the In Stock report.You can drag any report from the Steel Wheels folder in Public into the bottom dashboard panel. Enter a title for this dashboard panel and click Apply.
Click the Save as icon in the toolbar. When the Save As dialog box appears, save your dashboard as My Dashboard and click Save.
Close the dashboard (click the X to close it in the tabs at the top), then go to Browse Files and double-click on My Dashboard in the Files pane.
Results