OLAP Log Output

The Pentaho Server and the standalone Mondrian engine both use log4j to record information about generated OLAP-generated SQL queries. It may be useful to examine this log output if you are having trouble with configuration or performance-tuning.
Analysis SQL output logging
You can log SQL generation in the Pentaho Server or Mondrian engine.
Follow the directions below to turn on this SQL logging. If you are aware of other log4j classes that will assist you in configuration troubleshooting or performance-tuning, you can add them during this process.
Procedure
Stop the Pentaho Server or standalone Mondrian engine.
Edit the log4j.xml file in the /WEB-INF/classes/ directory inside of the deployed pentaho.war or Mondrian engine.
NoteIn some Mondrian implementations, this file is log4j.properties. Substitute this filename accordingly if you do not see a log4j.xml file.Add the following line anywhere inside of the
</log4j:configuration>node (but not inside of other constituent node tags):log4j.logger.mondrian.sql=DEBUG
Save and close the file.
Start the Pentaho Server or Mondrian engine.
Results
Enabling segment cache logging
The Pentaho Server allows you to view engine segment cache logs by opening the log window from within Analyzer.
If you are using Analyzer with a standalone Mondrian engine, cache log information is available through
log4j. Edit your log4j configuration as explained in Analysis SQL Output Logging, and set the value of com.pentaho.analysis.segmentcache to DEBUG. The table below lists other
log4j categories that can help you diagnose configuration and performance problems.
| Class Name | Cache System |
com.pentaho.analysis.segmentcache.impl.infinispan | Outputs information related to the Infinispan implementation of the segment cache. |
com.pentaho.analysis.segmentcache.impl.memcached | Outputs information related to the Memcached implementation of the segment cache. |
com.pentaho.analysis.segmentcache.impl.pentaho | Outputs information related to the Pentaho BI Platform Delegating Cache implementation. |
View Log Output in Analyzer
You can view the log in Analyzer.
Perform the following actions to view the log in Analyzer:
Procedure
Create a new Pentaho Analyzer report and drag a measure or a dimension in the report.
Once your report is displaying numbers, click on the top link, identified as More actions and options, and choose item.
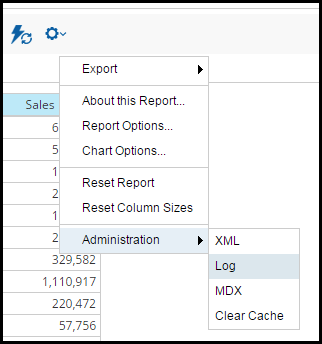 NoteIf there is no such link available within Pentaho Analyzer, it is because you have not used an administrator account to login to Pentaho User Console. You must log out and log back in using an administrator account credentials.
Results
If your plugin was successfully configured, you should see log information relating to the segment cache. If there was an error in your configuration, all exception messages will be displayed here as well.