Create queries

After connecting to most data sources, a query needs to be created and assigned a name to retrieve your data. This named query can be assigned to retrieve data for the master report, sub report, or parameter selections. A JDBC data source is used to access data from relational databases using the SQL query language. Pentaho also provides two data modeling layers, Pentaho Metadata Editor and Pentaho Analyzer. The Pentaho metadata layer focuses on reporting. The other layer focuses on analysis (OLAP). Pentaho metadata relies on Pentaho’s MQL query language where Pentaho Analyzer uses Microsoft Multidimensional Expression (MDX) query language.
Create queries with SQL Query Designer
You can use the SQL Query Designer interface to create a SQL query to get data. The SQL Query Designer is only available through the JDBC Data Source window. You must already have a JDBC data source configured and tested before using the SQL Query Designer. See Connect to a Data Source for more information on connecting to a JDBC data source.
Access the SQL Query Designer
Procedure
In the Data tab, right-click on Data Sets and select JDBC.
The JDBC Data Source window appears.Select your data source in the Connections pane on the left, then click the round green + icon above the Available Queries pane on the right.
Type a concise yet sufficiently descriptive name for your query in the Query Name field.
Click the pencil icon above the upper right corner of the Query field.
The SQL Query Designer tool appears, as shown in the following example: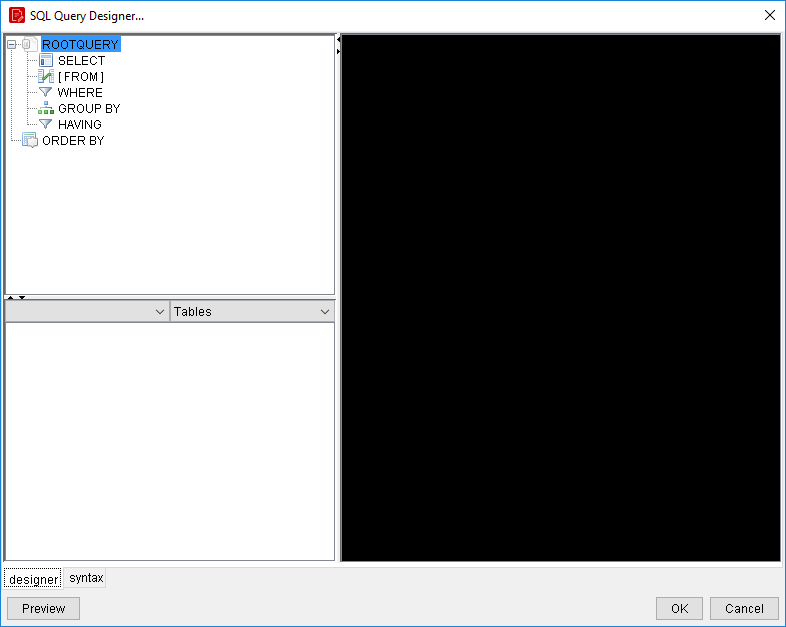
Apply query filters
Procedure
Select a schema filter in the menu above the lower left pane and ensure the type filter is set to Tables.
In the lower left pane, click to select the first table from which you want to refine data, then double-click it to move it to the query workspace.
As shown in the following example, the table you selected appears in the workspace as a sub-window containing all its rows: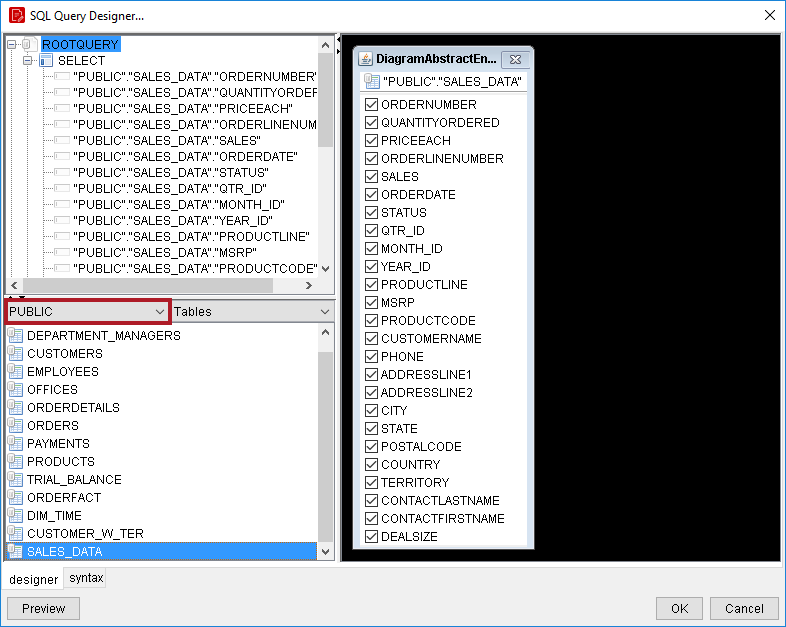
Check all the rows you want to include in the query.
By default, all rows are selected. If you only want to select a few rows (or a single row) in your query, click the table name at the top of the sub-window, then click deselect all in the popup menu, and check only the rows you want to include in your query.Repeat the previous step for other tables you want to include in the SQL query.
Refine the query
Procedure
To create an SQL JOIN between tables, select a reference key in one table, then drag it to the appropriate row in another table.
To modify the JOIN, right-click its red square, then click edit in the popup menu.To add a condition or expression, right-click a row in the query workspace, and select the appropriate action from the menu.
To order or group by a specific row, drag a statement from the SELECT category in the upper left pane and drop it into the GROUP BY or ORDER BY category.
Analyze results
Procedure
To edit the SQL syntax directly, click the syntax tab in the bottom left corner of the SQL Query Designer window.
Click Preview to view the unformatted query results.
Click OK to finish working on the query.
Results
Create sub-queries with SQL Query Designer
Procedure
Right-click on the query and select add where condition or add having condition.
The condition.edit window appears.Click on the arrow next to the working query so that the whole path is expanded. Type in the condition and click OK.
Click Preview to ensure the query is working. Click OK to exit the condition.edit window.
Drag the queries you have created into the workspace, in the Details row. Preview the report to ensure that everything is working as expected.
Results
Create queries with Metadata Query Editor
Perform the following step to design a metadata query for your data source with the Metadata Query Editor:
Procedure
In the Data tab, right-click on Data Sets and select Metadata.
The Metadata Data Source Editor window appears.Specify your XMI file and solution name, then click the round green + icon above the Available Queries pane on the right.
Type a concise yet sufficiently descriptive name for your query in the Query Name field.
With all your metadata data source options properly typed in, click the pencil icon above the upper right corner of the Query field.
The Query Editor window appears, as shown in the following example: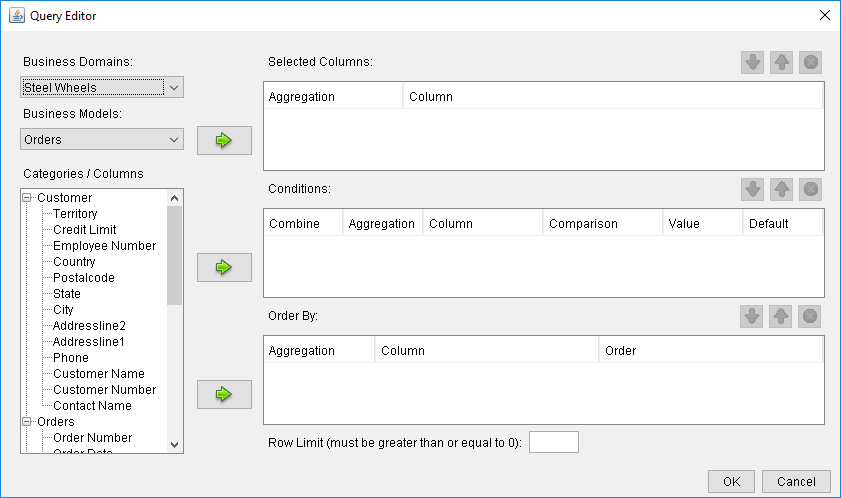 NoteIf the pencil icon is greyed out, then your data source is misconfigured.
Select a data set from the Business Models menu.
The list of available tables and columns will update appropriately.Double-click a table to display its columns, click on a column that you want to select, then click the arrow next to the Selected Columns box.
You can select multiple columns by holding down the Ctrl key while clicking on the columns.NoteTo define a parameter, specify the parameter's name by using curly brackets, {Parameter Name} for example. The parameter name must reference the parameter you created in your report. The Default value column is used to preview data in the Metadata Data Source Editor, only. To specify, multiple values for a parameter use a "|" (pipe) between your values as shown in the following example: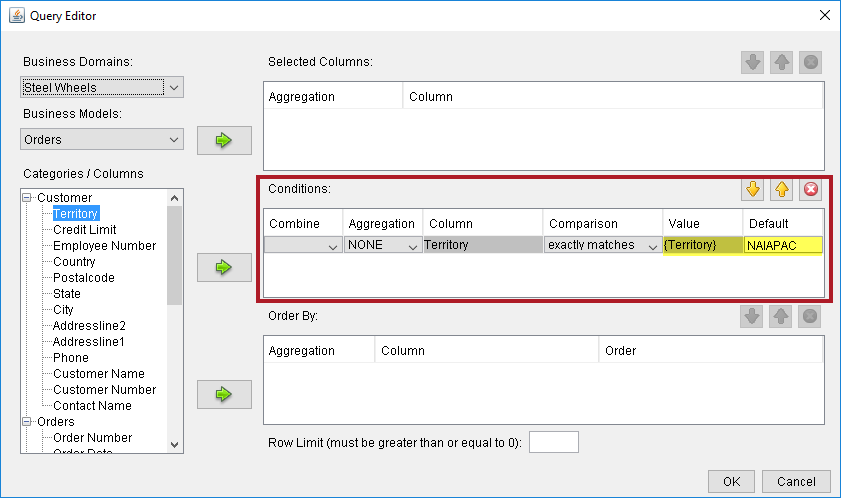
Repeat this process to create conditions for the additional columns by moving a column over to the Conditions box.
Condition values must be in double quotes (") to be validated in the Query Editor.Move the column by which you want to order your results into the Order By box.
Click OK to finalize the query.
Your new query will appear in the Query field of the data source configuration window. The Query field is editable. If needed, you can modify the query before continuing.Click OK to close the Metadata Data Source Editor.
Results
Create MDX queries
For Pentaho Analyzer data sets, such as OLAP and OLAP (advanced), you can create MDX queries by specifying a Mondrian cube definition schema file.
Before you begin
Perform the following steps to add a MDX query:
Procedure
In the Data tab, right-click on Data Sets and select one of the following options to access the Pentaho Analyzer Data Source Editor window:
Specify a Mondrian cube definition schema file for Pentaho Analysis Schema File.
You can use the Pentaho Schema Workbench to create this file.Select your data source in the Connections pane on the left, then click the round green + icon above the Available Queries pane on the right.
Type a concise yet sufficiently descriptive name for your query in the Query Name field.
Type an MDX query into the Query pane on the right.
See About Multidimensional Expression Language for more information on MDX.Click Preview to view the unformatted query results.
Click OK to finish working on the query.
Dynamic query scripting
For all JDBC, Metadata, and OLAP data sources, you can create a dynamic query through a Groovy or JavaScript script.
The two following scripting extensions are available in Report Designer:
Global
used to define shared functions or global variables that are available to all query scripts, and to dynamically change the data source configuration via the init() function.
Per-Query
used to customize a query string, calculate the "additional fields" information for query-caching, and post-process the returned table model.
A template for the two scripting languages is supported by default (JavaScript and Groovy). The template contains some guidance and instructions, as well as empty declarations for the functions to call. You can safely delete any function you do not need. If deleted, Report Designer ignores them. You can also load scripts from external sources, but you must ensure that they are available to the report at runtime.
Hadoop Hive-specific SQL limitations
A few of the following key limitations in Hive prevent some regular Metadata Editor features from working as intended, and limit the structure of your SQL queries in Report Designer:
- Outer joins are not supported.
- Each column can only be used once in a SELECT clause.
Duplicate columns in SELECT statements cause errors.
- Conditional joins can only use the = conditional unless you use a
WHERE clause.
Any non-equal conditional in a FROM statement forces the Metadata Editor to use a Cartesian join and a WHERE clause conditional to limit it.